Developer Offer
Try ImaginePro API with 50 Free Credits
Build and ship AI-powered visuals with Midjourney, Flux, and more — free credits refresh every month.
ChatGPT Predicts A Major Bitcoin Price Correction
As Bitcoin struggles to maintain its footing above the significant $100,000 support level, concerns are mounting about a potential drop to the $50,000 mark. We explored this possibility using insights from OpenAI's advanced AI, ChatGPT, which suggests that such a plunge could occur within the next few months.
ChatGPT's Bitcoin Crash Prediction
According to the AI model, Bitcoin's upward momentum is showing signs of weakness after it failed to sustain a price above $110,000. Key indicators, such as the Relative Strength Index (RSI) cooling to a neutral position and the price hovering just over its 200-day moving average near $87,000, signal that the current trend is losing steam.
Macroeconomic Headwinds and Market Pressure
On a broader economic scale, ChatGPT identified several potential drags on risk assets like Bitcoin. The Federal Reserve's cautious approach to interest rate cuts and the overall tightening of liquidity could suppress prices. Furthermore, an increase in exchange inflows indicates that more investors may be preparing to sell, adding to the downward pressure.
The AI suggests that a significant drop to $50,000 would likely be triggered by a confluence of negative factors. These include tightening liquidity, substantial outflows from Bitcoin ETFs, and large-scale profit-taking by institutional investors. A technical breakdown below key support levels at $87,000 and $80,000 could spark a wave of panic selling, reminiscent of the market crashes in 2018 and 2022.
A Potential Timeline for the Correction
If these risk factors converge, ChatGPT projects that the most probable timeframe for such a crash is between April and August 2026. This window aligns with Bitcoin's historical market cycles, which often see a peak 12 to 18 months after a halving event. A typical 60% to 70% correction from a projected cycle top of $130,000 to $150,000 would place the price squarely in the $50,000 range.
However, the AI also offered a less severe alternative. If macroeconomic conditions remain stable, Bitcoin might experience a milder pullback into the $70,000 to $80,000 range before continuing its next major uptrend.
Technical Analysis Supports Bearish Outlook
This AI-driven forecast is echoed by technical indicators and market analysts. In a recent X post, cryptocurrency analyst Ali Martinez noted that Bitcoin's next major market bottom could be approximately 328 days away, pointing to a timeline around October 2026.
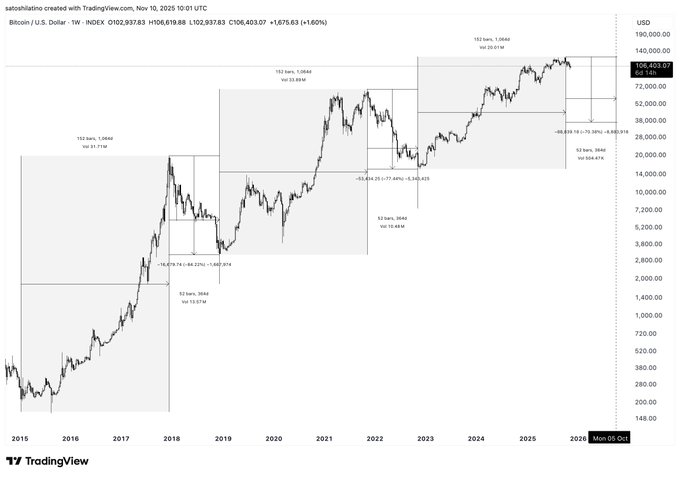
Martinez's analysis suggests that Bitcoin is following a cyclical pattern seen in previous market phases, where bull run peaks are followed by extended drawdowns. His projected bottom range of $38,000 to $50,000 aligns with historical retracement levels, implying that the asset may face continued downside pressure as the post-halving rally matures.
Current Bitcoin Price Action
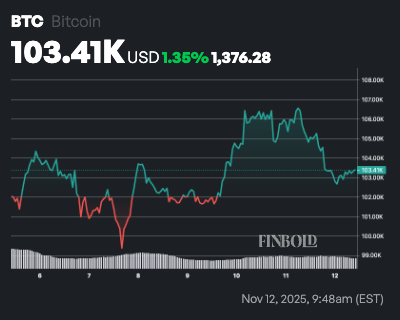
At the time of writing, Bitcoin was trading at $103,411, reflecting a 1.4% decrease in the last 24 hours. On the weekly chart, it has posted a slight gain of 1.3%.
Technically, Bitcoin's price is currently below both its 50-day Simple Moving Average (SMA) of $112,216 and its 200-day SMA of $105,751. This positioning confirms a bearish trend in the short to medium term. While the 200-day SMA offers a fragile line of support for the long-term uptrend, the 50-day SMA is acting as overhead resistance. The 14-day RSI at 47.76 is neutral, indicating no extreme momentum in either direction.
Compare Plans & Pricing
Find the plan that matches your workload and unlock full access to ImaginePro.
| Plan | Price | Highlights |
|---|---|---|
| Standard | $8 / month |
|
| Premium | $20 / month |
|
Need custom terms? Talk to us to tailor credits, rate limits, or deployment options.
View All Pricing Details