Developer Offer
Try ImaginePro API with 50 Free Credits
Build and ship AI-powered visuals with Midjourney, Flux, and more — free credits refresh every month.
When Will XRP Hit 10 Dollars AI Weighs In
US Spot XRP ETF Makes Strong Market Debut
The recent launch of the first United States-listed spot XRP exchange-traded fund (ETF) has generated significant buzz, infusing the digital asset with fresh momentum as it aims for new all-time highs. Given the immense scale of U.S. financial markets, there are high expectations that this new ETF could propel XRP to higher price levels.
In a landmark event for the asset, the REX-Osprey XRP ETF (XRPR) began trading on the Cboe BZX exchange on September 18, immediately ranking among the most successful debuts of the year. The fund achieved an impressive $37.7 million in first-day volume, with about $24 million of that total traded within the first 90 minutes.
Despite these strong inflows, XRP’s price has hovered near the $3 mark, suggesting investors are waiting for signs of broader adoption and potentially more ETF approvals before triggering a major rally. The pipeline for additional products looks promising, with major issuers like Bitwise, WisdomTree, 21Shares, Franklin Templeton, CoinShares, Grayscale, and Canary Capital having already filed applications for their own spot XRP ETFs.
AI Predicts XRP's Path to $10
To gain insight into XRP's potential price trajectory, we consulted OpenAI's ChatGPT-5 model. The AI noted historical precedents set by other crypto ETFs. When U.S. spot Bitcoin ETFs launched in early 2024, BTC surged nearly 70% in just two months to a new record. Similarly, Ethereum’s spot ETFs fueled a 50% rally within weeks. If XRP follows a similar pattern, analysts anticipate significant upside.
ChatGPT-5 outlined three potential scenarios for XRP's future:
- Conservative Case: XRP could climb to about $5 by early 2026.
- Moderate Case: The asset could reach $7 by mid-2026.
- Bullish Case: Driven by strong ETF inflows, new approvals, and favorable market conditions, XRP could hit $10 by the end of 2026.
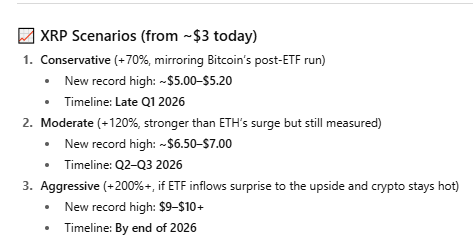 XRP price prediction after ETF launch. Source: ChatGPT
However, the model also cautioned that this timeline is highly dependent on factors like investor adoption rates, regulatory clarity, and broader macroeconomic trends.
Current XRP Price and Technical Analysis
As of this writing, XRP is trading at $3.01, showing a slight decrease of about 1% in the last 24 hours and over 4% on the week.
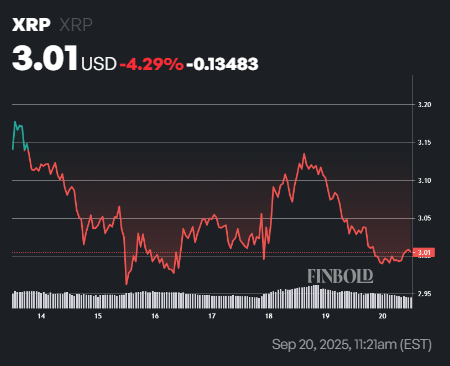 XRP seven-day price chart. Source: Finbold
The token is currently holding near its 50-day simple moving average (SMA) at the same level. The 200-day SMA is lower at $2.56, which points to a sustained upward trend over the long term.
Short-term indicators remain mixed. The 14-day relative strength index (RSI) is at 50.50, reflecting a neutral market stance. Meanwhile, volatility is relatively low at 3.38%, signaling that price swings are modest but steady for the time being.
Compare Plans & Pricing
Find the plan that matches your workload and unlock full access to ImaginePro.
| Plan | Price | Highlights |
|---|---|---|
| Standard | $8 / month |
|
| Premium | $20 / month |
|
Need custom terms? Talk to us to tailor credits, rate limits, or deployment options.
View All Pricing Details